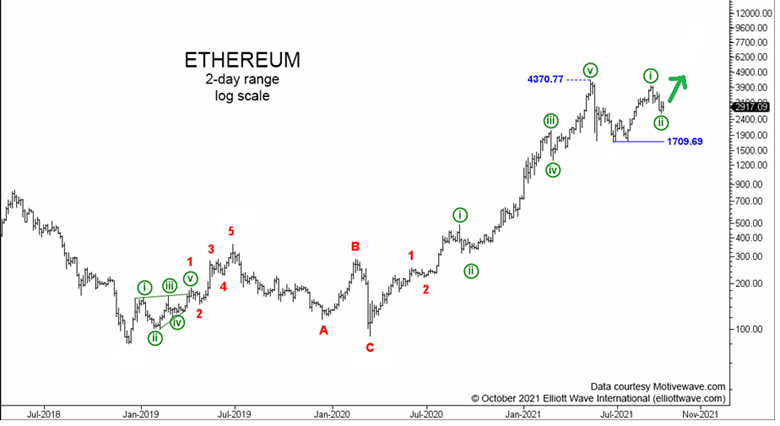
On October 1, our Global Market Perspective showed this Ethereum chart (green arrow added; detailed wave labeling reserved for subscribers):

When this chart went live on October 1, ETH traded at $2917. The wave pattern called for a big rally.
Today, as I’m typing this, ETH is at $4763. That’s a 63% rally!
That’s the power of Elliott wave analysis.
We just posted our new, monthly global market guidance for 50+ of the world’s top markets. Just pick the publication that suits you best…
Aucun commentaire:
Enregistrer un commentaire