Il FTSE MIB ha guadagnato circa lo 0,5% per chiudere a 37.242 lunedì, estendendo i guadagni della settimana precedente, in linea con le sue controparti europee. Gli investitori hanno atteso ulteriori utili societari e dati economici, valutando al contempo le implicazioni dei nuovi dazi statunitensi. Il presidente Donald Trump ha annunciato l'intenzione di imporre tariffe del 25% su tutte le importazioni di acciaio e
alluminio negli Stati Uniti e ha indicato che questa settimana saranno introdotte nuove tariffe reciproche. Nel frattempo, il presidente Jerome Powell terrà la sua testimonianza semestrale davanti alle commissioni di Camera e Senato martedì e mercoledì. Tra i singoli titoli, Tenaris ha registrato un'impennata di quasi il 5% in vista della relazione sugli utili, mentre Iveco Group ha continuato a registrare una forte performance. Tuttavia, le banche hanno sottoperformato mentre gli investitori attendevano aggiornamenti sulle prospettive di rischio del settore, con Banca Generali che è stata un'eccezione notevole, salendo del 3,1% dopo aver riportato forti risultati preliminari per il 2024. Nexi ha perso l'1,8% dopo il calo di oltre il 4% di venerdì, a causa di speculazioni sull'uscita di fondi dal suo capitale.
*************************************************
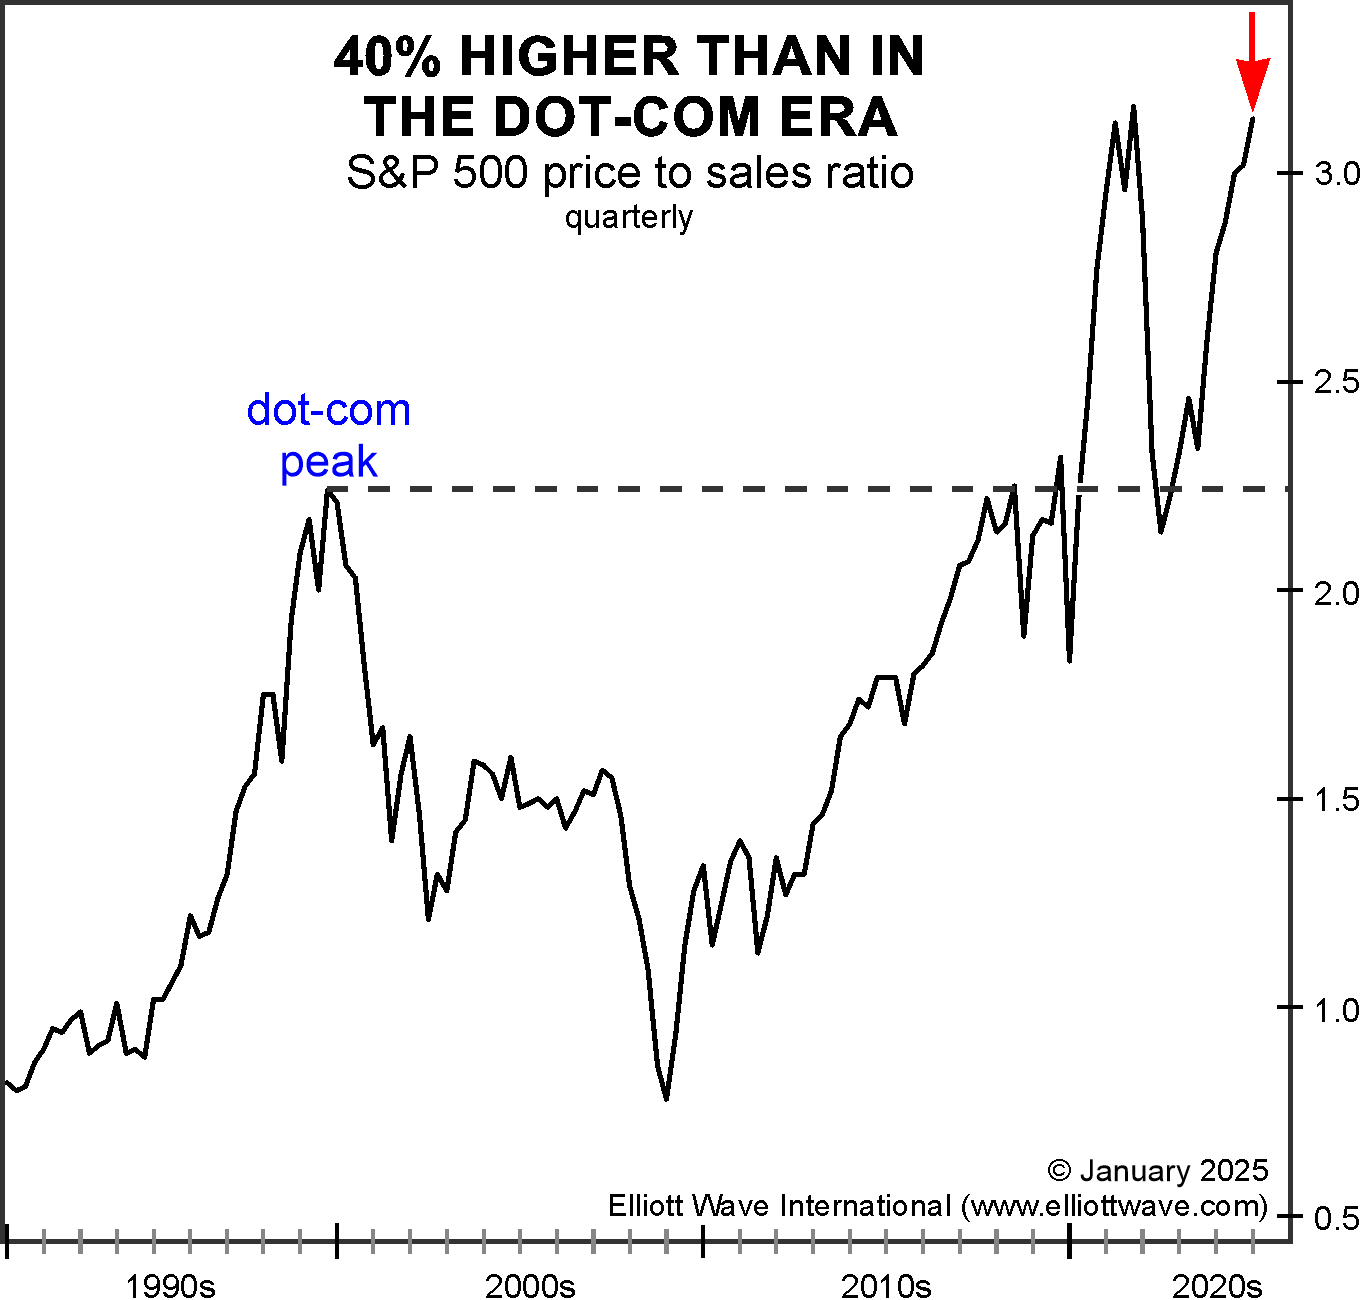
Most of us LOVE to buy stuff when it’s on sale. But our brains work differently when it comes to the stock market. Here’s what I’m talking about (courtesy of the February Elliott Wave Financial Forecast):
The chart below shows that the S&P 500 price-to-sales ratio is 3.1, meaning that investors are willing to pay over $3 for every dollar of sales generated by the index’s companies. This is 40% higher than at the end of the dot-com boom in 2000: |
 |
The next chart below shows another key valuation ratio: the FT Wilshire 5000, the broadest measure of U.S. stock market performance, relative to annual U.S. GDP. The current ratio is 2.05, a record extreme over the past half century. The most recent important development is the ratio’s intersection with the resistance line of its long term channel. The channel starts at the key low in August 1982 and connects to the low in March 2009. These are two of the most memorable low points for stock prices. The top channel line comes off the extreme in December 2021, the month between the highs in the NASDAQ indexes and the Dow and S&P 500: |
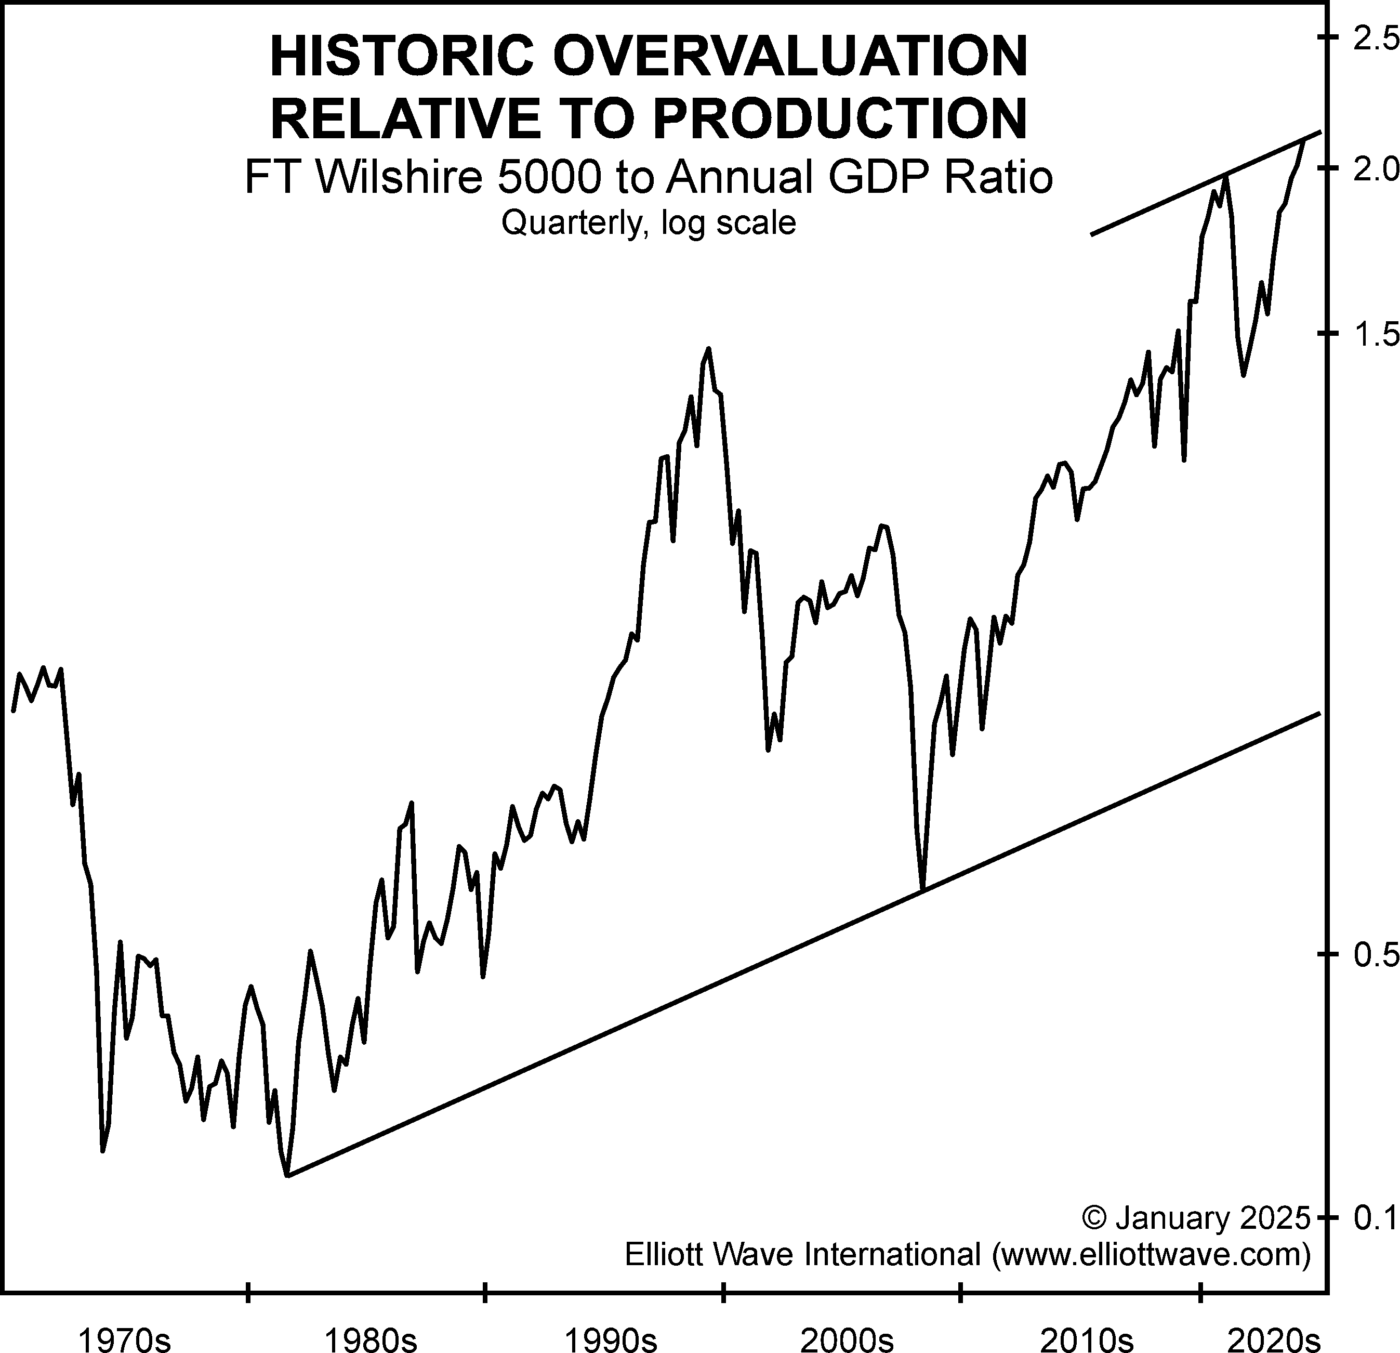 |
Keep in mind that today’s extreme valuations do not mean that the stock market will collapse immediately. Nor do they mean that it won’t! Valuations are not meant to be used for precision market timing. Yet, the market’s Elliott wave pattern reveals insights which investors need to know now. Get those insights when you subscribe to the Financial Forecast today.
Not ready for a subscription?
Aucun commentaire:
Enregistrer un commentaire