Martedì l'indice FTSE MIB ha chiuso in ribasso del 2,1% a 42.839 punti,
sulla scia delle preoccupazioni globali relative alle valutazioni gonfiate dei titoli
tecnologici e all'incertezza sulle prossime mosse della Federal Reserve. Gli operatori sono
in attesa dei risultati finanziari del gigante dell'intelligenza artificiale Nvidia, mentre le
aspettative di un taglio dei tassi si sono notevolmente ridotte negli ultimi giorni. Cresce anche
l'attesa per il rapporto sull'occupazione negli Stati Uniti di settembre, ritardato a causa della chiusura
del governo. Tutti i titoli italiani hanno chiuso in ribasso, ad eccezione di Hera, che ha guadagnato lo 0,8%.
Tra i titoli con le peggiori performance figurano Telecom Italia (-6,7%), Stellantis (-4,4%), MPS (-3,7%)
e Banca Popolare di Sondrio (-3,5%). Tra i pesi massimi, UniCredit ha perso l'1,9%, Intesa Sanpaolo il 2,9%,
Generali l'1,5%, Eni l'1,2%, Enel lo 0,8% e Ferrari il 3,2%. Nel settore tecnologico, anche STMicroelectronics
(-2,5%) e Leonardo (-1,8%) hanno registrato perdite insieme a TIM.
********************************************************************************
The Elliott Wave Principle is based on the concept that crowd behavior is patterned and that these patterns are easily discerned in the prices of freely traded markets. This alone sets it apart in the world of market analysis. Here are five benefits:
1. Identifies Dominant Trend in Any Timeframe
The Wave Principle identifies the direction of the dominant trend in any timeframe. A five-wave advance on a daily chart identifies the dominant trend as up. Looking at the same instrument on an hourly chart might reveal that the trend on an hourly basis is down within the larger daily chart.
2. Identifies a Countertrend Move
The Wave Principle also identifies countertrend moves. The three-wave pattern is a corrective response to the preceding five-wave pattern. Knowing that a near-term decline in price is merely a correction within a larger uptrend is valuable information.
3. Identifies the Maturity of a Trend
Elliott catalogued a finite number of patterns to which the markets adhere. Once a pattern is over, it’s over. For example, if prices are advancing in the fifth wave of a five-wave advance, and the fifth wave has already completed four of its subwaves, one more subwave is all that is required to complete the pattern, which, by definition, will lead to a change of trend.
4. Identifies Price Targets
The Wave Principle also provides price targets based on common pattern relationships. When R.N. Elliott wrote about the Wave Principle in Nature's Law, he stated that the Fibonacci sequence was the mathematical basis for the Wave Principle. Elliott waves, both impulsive and corrective, frequently adhere to Fibonacci proportions, as illustrated in Figure 2-1. |
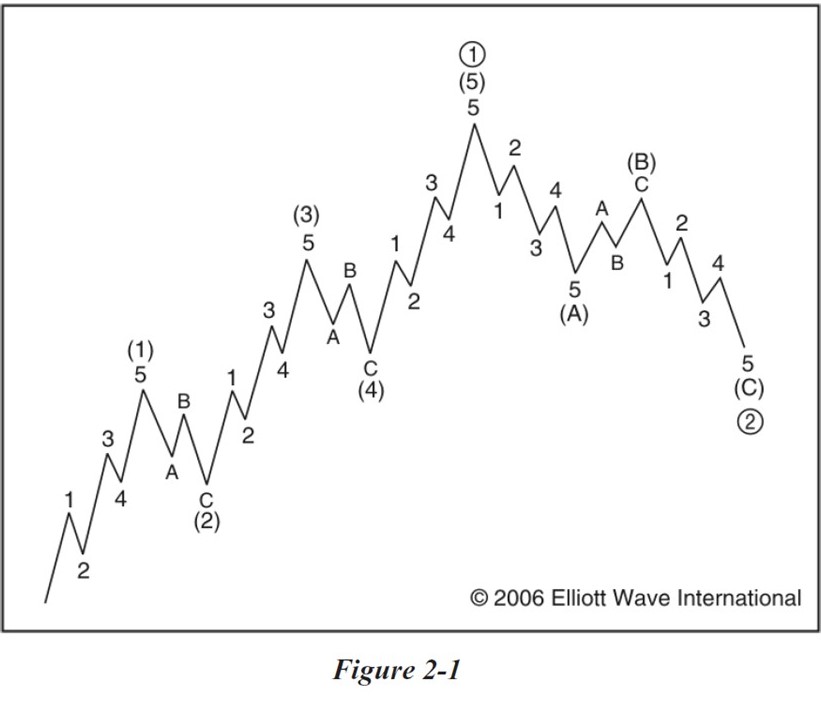 |
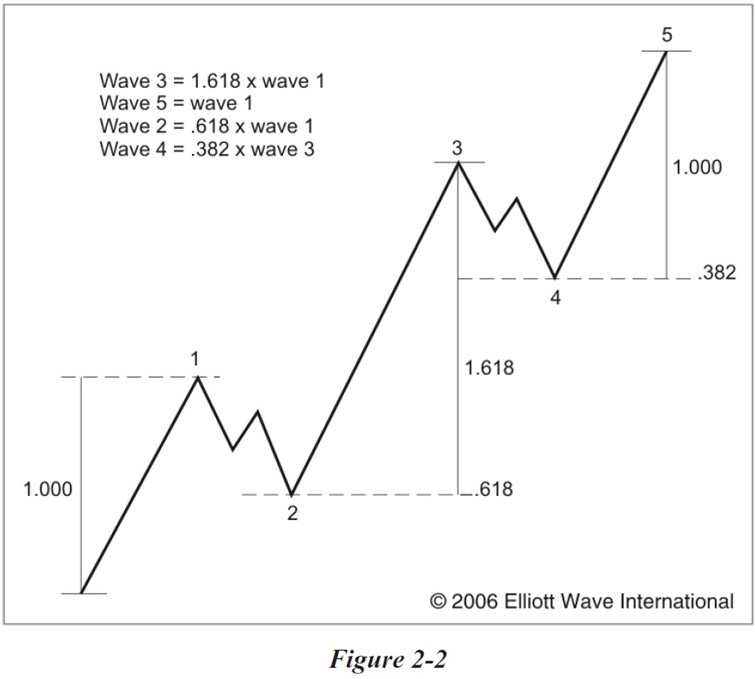
5. Identifies Context
Elliott observed that wave patterns form larger and smaller versions of themselves. This repetition in form means that price activity is fractal, as illustrated in Figure 2-2. Wave (1) subdivides into five smaller waves and is simultaneously part of a larger five wave pattern. This process is occurring at every degree, all the time, and is the key to understanding what market probabilities are. |
 |
To learn more about Elliott waves, check out our FREE (for a limited time) on-demand course, “Why Wave Analysis Belongs In Every Trader’s Toolbox.”
Aucun commentaire:
Enregistrer un commentaire