The reigning theory of stock market pricing says investors rationally revalue stocks as new information enters the marketplace.
If that were true, stock charts would look like this:
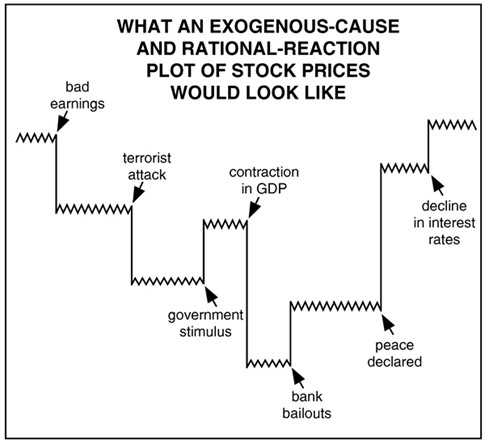 |
The stock market would trend mostly sideways, fluctuating within narrow ranges as minor bits of news mostly canceled each other out. Sharp jumps or drops to new planes of stability would occur when major news broke and investors adjusted prices to a new level.
But real market charts don’t look like that.
In reality, stock prices run wildly up and down every second, minute, hour, day, week, month, year and decade.
Almost no one questions the exogenous-cause theory of pricing.
Elliott Wave International did.
EWI tested 13 widely accepted claims that link economic, political and monetary variables to market movements.
Learn what they discovered when you read the first two chapters of Robert Prechter’s The Socionomic Theory of Finance – free.
Aucun commentaire:
Enregistrer un commentaire